If you’ve spent any time troubleshooting network issues on Linux, you know the frustration of trying to figure out what’s happening with your connections. The ss command is one of those tools that makes that job significantly easier. It’s fast, it’s powerful, and once you get the hang of it, you’ll wonder how you ever managed without it.
I remember the first time a service refused to start because something else was hogging the port. Spent way too long digging through logs before learning that checking open ports with the right tool would have solved it in seconds. That tool is ss.
What is the ss Command in Linux?
The ss command stands for socket statistics. It displays information about network sockets on your Linux system. Think of sockets as the endpoints where your applications send and receive data over the network. Every web server, database connection, and SSH session uses sockets to communicate.
This tool is part of the iproute2 package, which comes pre-installed on most modern Linux distributions. You don’t need to install anything extra to start using it.
Why ss Replaced netstat
If you learned Linux networking a few years back, you probably used netstat for everything. Here’s the deal: netstat is deprecated. It’s no longer being actively maintained, and on newer systems, it might not even be installed by default.

Get a VPS from as low as $11/year! WOW!
The ss command replaced netstat because it’s faster and more capable. While netstat reads information from files in the /proc filesystem, ss uses the Linux kernel Netlink documentation interface to communicate directly with the kernel. This makes a huge difference when you have thousands of active connections.
How ss Accesses Socket Information
When you run ss, it sends a request to the kernel through Netlink and gets back exactly the socket data it needs. No parsing text files. No converting formats. Just direct, efficient data transfer.
This matters when you’re troubleshooting a busy server. On a system with 10,000 connections, ss returns results in milliseconds while netstat might take several seconds to parse all those /proc files.
Basic ss Command Syntax and Options
The basic syntax is straightforward:
ss [options] [filter]Run ss without any arguments and you’ll see all established connections. That’s usually more information than you need, so options help you narrow things down. For the complete reference, check the official ss man page.
Understanding the Default Output
When ss displays results, you’ll see columns for:
- State: The current connection state (ESTAB, LISTEN, TIME-WAIT, etc.)
- Recv-Q: Bytes in the receive queue waiting to be read
- Send-Q: Bytes in the send queue waiting to be transmitted
- Local Address:Port: Your system’s IP and port
- Peer Address:Port: The remote system’s IP and port
Most Useful ss Options
Quick Reference:
-a— Show all sockets (listening and non-listening)-l— Show only listening sockets-t— Show only TCP sockets-u— Show only UDP sockets-n— Don’t resolve hostnames (faster output)-p— Show process information (needs root)-s— Display socket statistics summary
Pro tip: Always use the -n flag unless you specifically need hostname resolution. Without it, ss tries to resolve every IP address to a hostname, which can make output painfully slow on systems with many connections.
Essential ss Command Examples You’ll Use Daily
Here are the commands that solve the problems you actually run into. Keep these in your notes.
Show All Listening Ports
Want to see what’s listening on your system? This is the command:
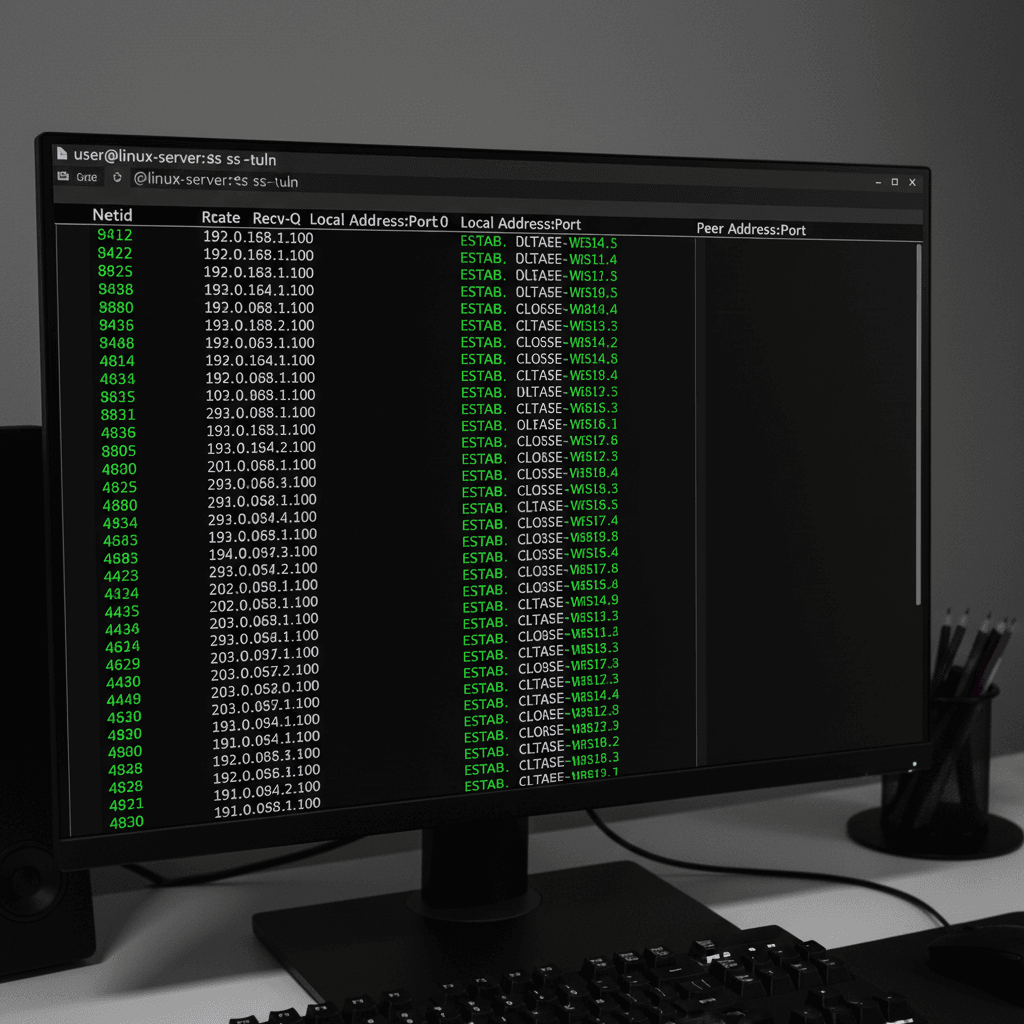
ss -tulnThis shows all TCP (-t) and UDP (-u) sockets in the listening (-l) state, with numeric port numbers (-n). You’ll see which ports are open and ready to accept connections.
Display All TCP Connections
To see every TCP connection, including established ones:
ss -tanThe -a shows all connections (not just listening), -t filters to TCP only, and -n keeps it fast by skipping DNS lookups.
Find Which Process is Using a Port
This is the one that saves your bacon when a service won’t start:
sudo ss -tulnpThe -p option shows process information. You need sudo because reading process details requires elevated privileges. This tells you exactly which process owns each socket.
Once you identify the culprit, you can use the lsof command for even more detailed file and socket investigation, or kill the process if needed.
View Socket Statistics Summary
For a quick overview of your system’s socket usage:
ss -sThis gives you totals for TCP, UDP, and other socket types. It’s useful for getting a sense of overall connection volume without wading through detailed output.
Understanding TCP Socket States
The State column in ss output tells you what’s happening with each connection. Understanding these states helps you diagnose problems faster. The RFC 9293 TCP specification defines these formally, but here’s what matters practically.
ESTABLISHED vs LISTEN States
LISTEN means a socket is waiting for incoming connections. Your web server listens on port 443, your SSH daemon listens on port 22. These are services ready to accept clients.
ESTABLISHED means two endpoints have completed the TCP handshake and are actively transferring data. When someone visits your website, that connection shows as ESTABLISHED.
TIME_WAIT and Why It Exists
You’ll often see lots of sockets in TIME_WAIT state. This isn’t a problem—it’s by design. When a connection closes, the socket stays in TIME_WAIT for about 60 seconds to handle any delayed packets from the old connection.
High TIME_WAIT counts on a busy server are normal. Only worry if you’re seeing connection failures or running out of available ports.
Filtering ss Output for Specific Information
The real power of ss comes from its filtering capabilities. Native filters are much faster than piping through grep because the filtering happens inside the tool before output is generated.
Filter by Port Number
To see connections on a specific port:
ss -tan sport = :443This shows all TCP connections where the source port is 443 (typically HTTPS traffic). You can also filter by destination port:
ss -tan dport = :22Filter by Connection State
To see only established connections:
ss state establishedOr just the listening sockets:
ss state listeningCombining Multiple Filters
You can combine filters for precise results. Show all established TCP connections on port 80:
ss -tan state established sport = :80For more complex filtering, you can still pipe output through grep, but use native filters first for better performance.
Real-World Troubleshooting with ss
Theory is nice, but let’s look at actual problems you’ll encounter.
Diagnosing a Service That Won’t Start
Your web server fails to start with “Address already in use.” Here’s your workflow:
- Check what’s using port 80:
sudo ss -tulnp sport = :80 - Identify the process holding the port
- Decide whether to stop that process or reconfigure your service
- Verify using systemd service troubleshooting to confirm your service now starts
Finding Connection Bottlenecks
When users complain about slow performance, check your connection states:
ss -tan | awk '{print $1}' | sort | uniq -c | sort -rnThis shows a count of connections by state. Lots of SYN_RECV might indicate SYN flood attack. Many CLOSE_WAIT suggests your application isn’t closing connections properly.
Combine this with the top command for real-time monitoring to correlate connection issues with resource usage.
Monitoring Active Web Server Connections
Track how many clients are connected to your web server:
ss -tan state established dport = :443 | wc -lRun this periodically during high traffic to understand your connection patterns. For deeper analysis, add network interface diagnostics and testing network connectivity to your troubleshooting toolkit.
ss vs netstat: Why You Should Switch
Still using netstat? Here’s your migration guide:
Command Equivalents:
netstat -tulnp | → ss -tulnp |
netstat -an | → ss -an |
netstat -s | → ss -s |
netstat -r | → ip route |
The syntax is nearly identical for most operations. The main differences:
- Speed: ss is 3-5x faster on systems with many connections
- Detail: ss can show TCP congestion control info and socket memory usage
- Filtering: Native filters in ss are more powerful than netstat’s options
- Maintenance: netstat is deprecated; ss is actively developed
Make the switch. Your future self will thank you when you’re troubleshooting under pressure and ss gives you answers in milliseconds instead of seconds.
The ss command isn’t complicated once you know the key options. Start with ss -tulnp for listening ports, ss -tan for all TCP connections, and ss -s for a quick summary. Build from there as you need more specific information. The ability to quickly identify what’s using your ports and diagnose connection problems is fundamental for anyone managing Linux systems.